Below, we explain how to show GIS data in any browser in 4 simple steps.
Step 1
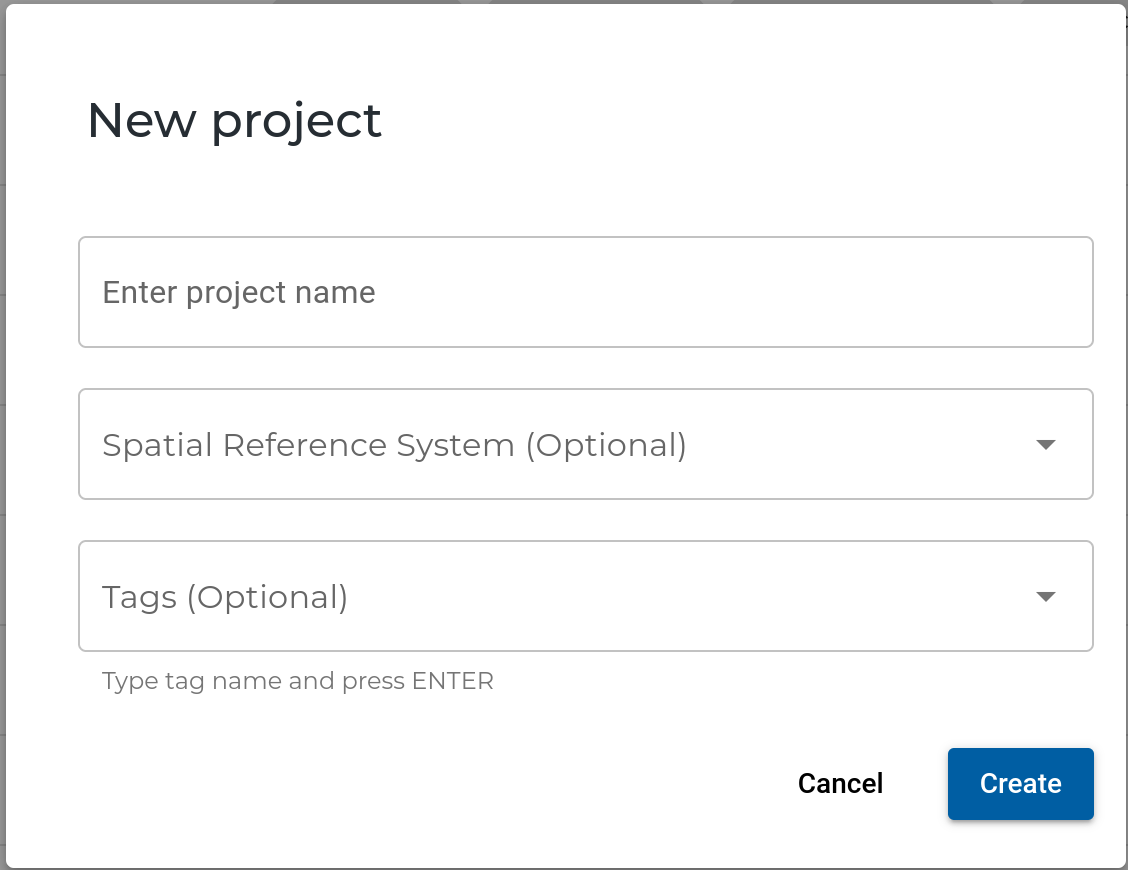
Create a new project from the home screen. Typically one project holds data for a specific site.

In the New project dialog specify “Project name”. Other fields are optional:
- Spatial Reference System allows the user to select a horizontal projection system. If projection is custom and does not have known EPSG code, please follow this guide
- Tags help to find your project in the future by assigning some meaningful labels

Step 2
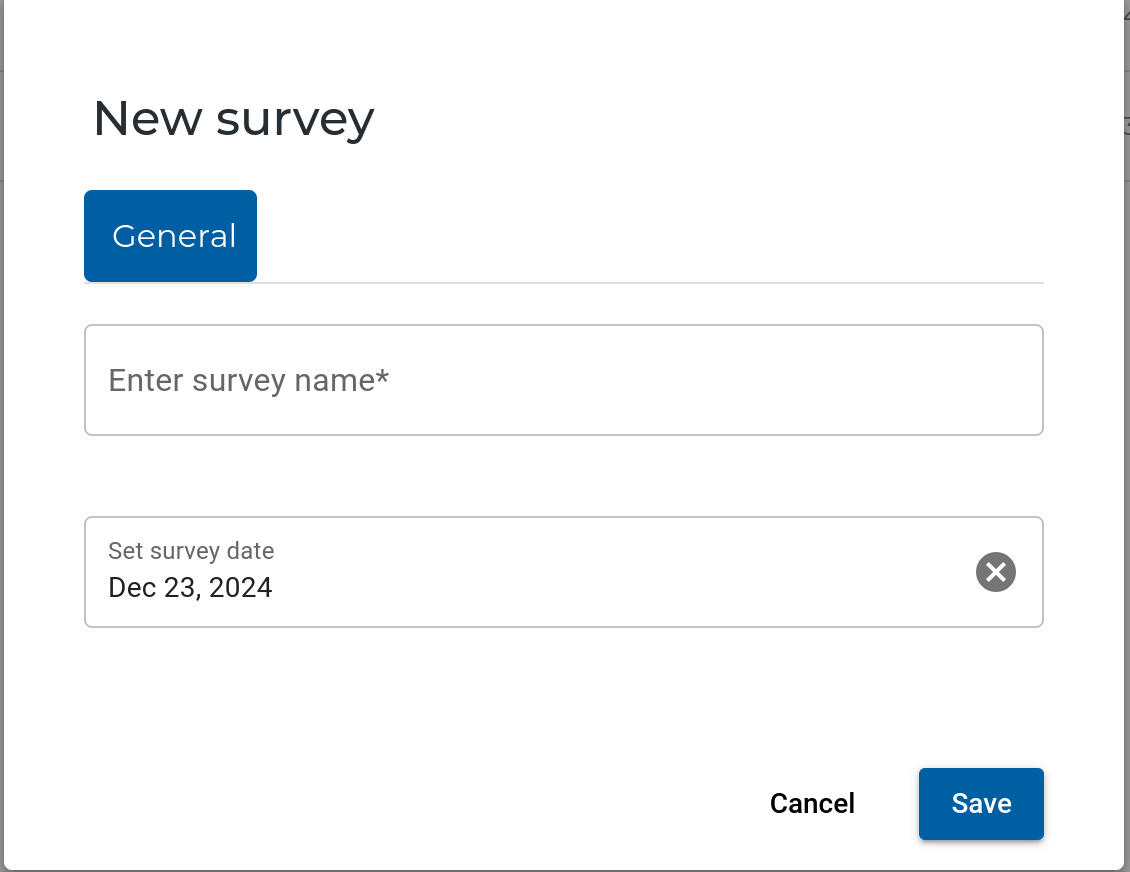
Inside the project, create a new survey. Survey is a place where you can put all your mapping products for a specific date.

In a survey creation dialog specify a meaningful name for a survey and select a data collection date.

Step 3
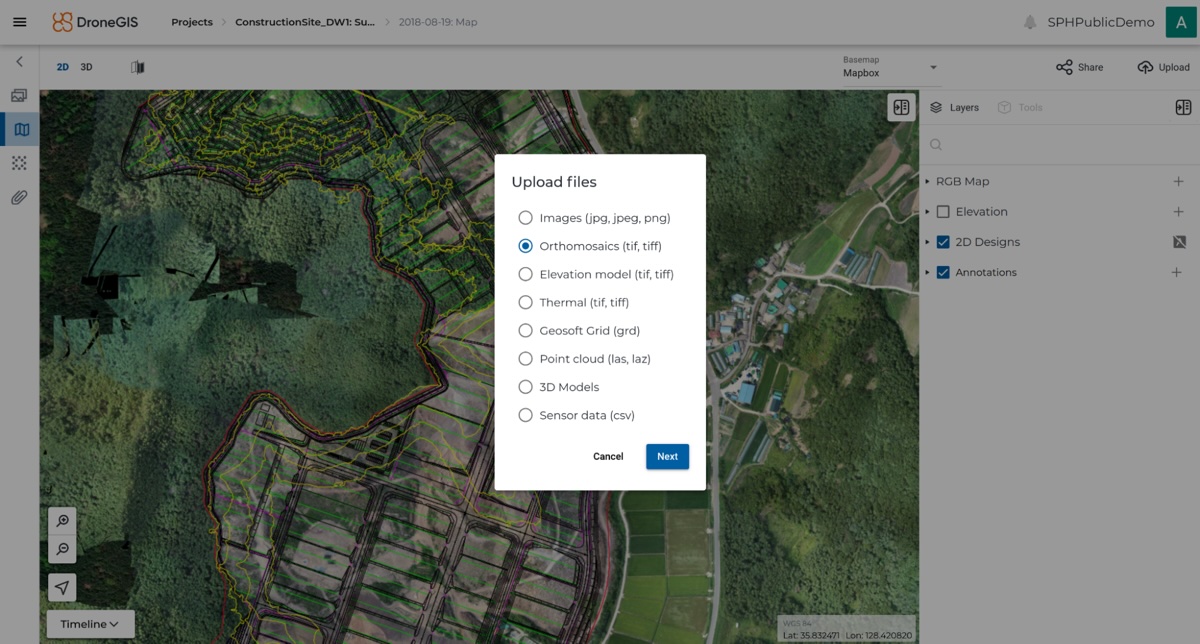
DroneGIS supports various layers:
- Orthomosiacs
- DEM
- Thermal
- Geosoft grids
- Point clouds
- 3D models
- DXF/DWG drawings
To upload most of them simply select a proper type in the Upload dialog, then select files and wait while the server converts them into a format suitable for browser viewing.

In the case of DXF/DW files, take a look at this guide.
In the case of Point Cloud, use this guide.
Step 4
After uploading data is available in both 2D and 3D views.

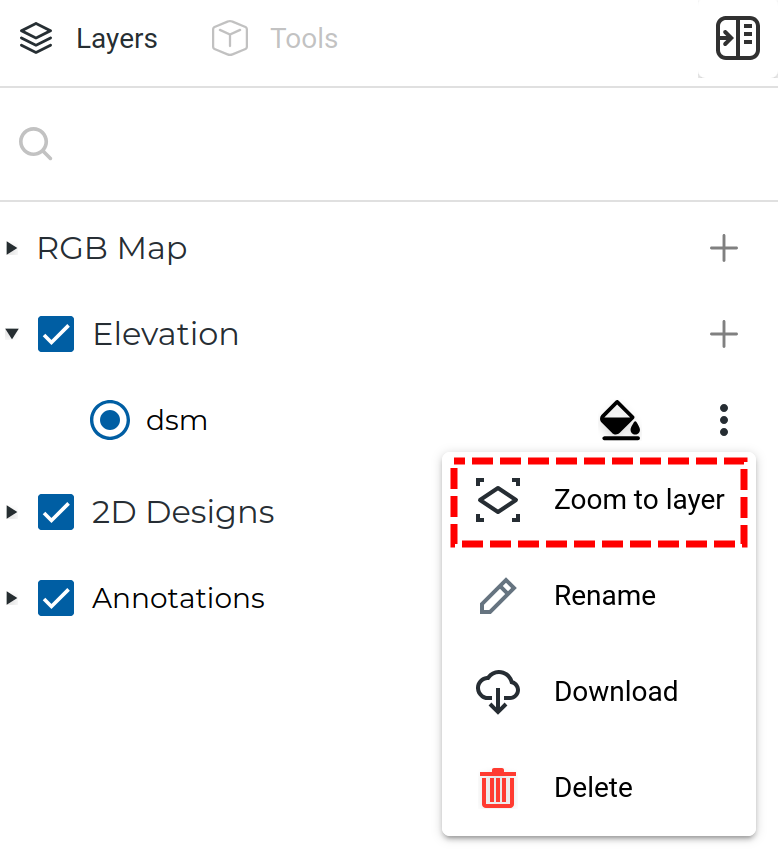
Almost every layer has a “Zoom to layer” command in the context menu, which helps focusing on the layer bounding box quickly.


