
.jpg)
Introduction
The test was carried out on the 9th of May 2024 at the OSU Center for Fire and Explosives, Forensic Investigation, Training and Research (CENFEX) range in Pawnee County, Oklahoma, USA (36°21'11.4"N 96°51'25.5" W), where various ferrous and non-ferrous items and UXOs were shallowly buried (up to the depth of 20cm) or placed on the ground surface. In total, 131 objects were set in a 280 sq.m. area. Magnetometers used in this survey were MagNIMBUS magnetometer by SPH Engineering with QuSpin QTFM Gen-2 sensor and SENSYS MagDrone R1 magnetometer with FGM3D fluxgate sensors by SENSYS. The UAV used in the survey was DJI M350RTK. Data processing and target detection were done in Geosoft Oasis Montaj v2024.1.
Links to access the data (raw and processed):
Data collected by Dylan Owens1. Data processing and report by Maikls Andriksons2 and Alexey Dobrovolskiy2.
1 SPH Technologies USA, USA (SPH Engineering’s subsidiary in the US)
2 SPH Engineering SIA, Latvia
Disclaimer:
The term "detected" here means that the data interpreter has identified a strong enough signal that warrants further examination or action. Interpretations are subjective and will change depending on the experience and knowledge of the interpreter.
Neither SPH Engineering SIA nor SENSYS Sensorik & Systemtechnologie GmbH makes any claims or warranty that detection of the same or similar or similar targets is guaranteed under any conditions other than in the OSU’s Center for Fire and Explosives, Forensic Investigation, Training and Research (CENFEX) test range using the same or different hardware, software, and workflow.
This report is provided "as is" and is intended to demonstrate the capabilities of the system described herein and provide some guidance for planning UXO surveys.
Methods
The test setup
The test was conducted at the OSU’s Center for Fire and Explosives, Forensic Investigation, Training and Research (CENFEX) range, Pawnee, Oklahoma, USA, an open test field. This field was initially seeded in March 2023 and was reseeded at a permanent location in June 2023. The primary purpose of this seeded field is to serve as a resource and benchmark, allowing researchers to test various methods and instruments for landmine and UXO detection. The field is operated and designed by the Demining Research Community and the OSU Global Consortium for Explosive Hazard Mitigation.
The test field is located in a rural area with a semi-dense forest nearby and is 300 m from the nearest public road with a power line running along it. A small metal shack is located near the test field, which consists of a metal roof and a few supports made from stainless steel. According to the Demining Research Community, the test range is located on a previous explosive test range therefore, it is littered with small metal fragmentation, which can interfere with acquired magnetic maps and data processing. An orthomosaic that was used in the report was made and processed by Jasper Baur and Gabriel Steinberg from the Demining Research Community using Pix4Dmapper and georeferenced in QGIS using ground control point coordinates collected with the Trimble- Geo7x.
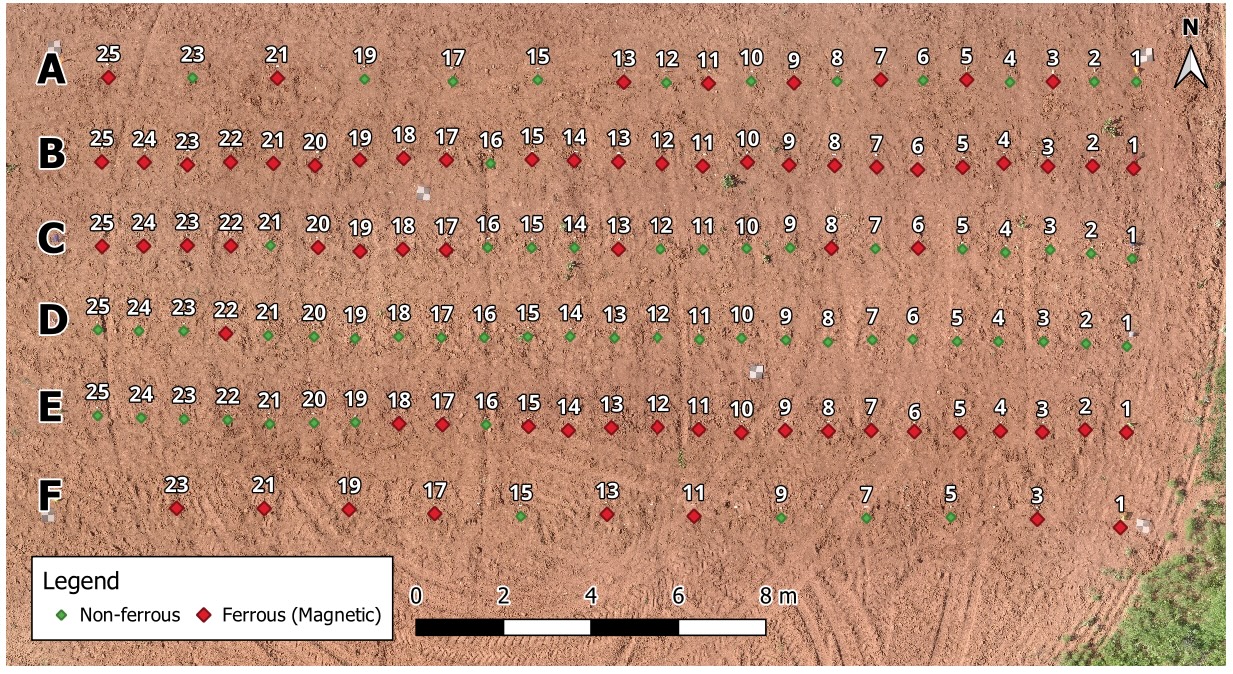
A regular layout of 25x10m (X and Y axis) was made where various items were placed on the ground or buried at systematically varying depths (up to 20 cm) under topsoil sediments, which consist of silt loam and silty-clay loam. Distance from each object on the X axis was 1 m and 2 m on the Y axis (Figure 1). Non-ferrous objects (plastic, aluminum, copper) will fail to appear in the magnetic data. Targets were referenced with set parameters such as longitude, latitude, weight, ferricity, etc.
Both magnetometer setups (MagNIMBUS and MagDrone R1) were flown over the survey area with flight altitudes of 0.2 m, 0.5 m and 1.0 m (the distance from the ground to magnetometer sensor) in parallel lines with 1-m separation. All flight lines had a small run-off of 3 m at the end to make up for the correct data acquisition in the intended survey area. In total, 6 data sets were collected.
All flights were planned and conducted by an experienced pilot using SPH Engineering’s UgCS (Universal Ground Control System) software and SkyHub onboard computer. For keeping precise altitude above the ground, the True Terrain Following system by SPH Engineering with a laser altimeter was used.
GNSS system
Both magnetometers were attached to DJI M350 RTK UAV that implements GNSS (Global Navigation Satellite System) with RTK (Real Time Kinematics) for precise positioning. In this survey, however, the RTK system malfunctioned because of weak or non-robust LTE/4G coverage, which compromised the consistent reception of RTK corrections, therefore the data acquisition for flight maneuver path was not in perfectly straight lines – at times overlapping each other. This created a set of problems when working with data processing.
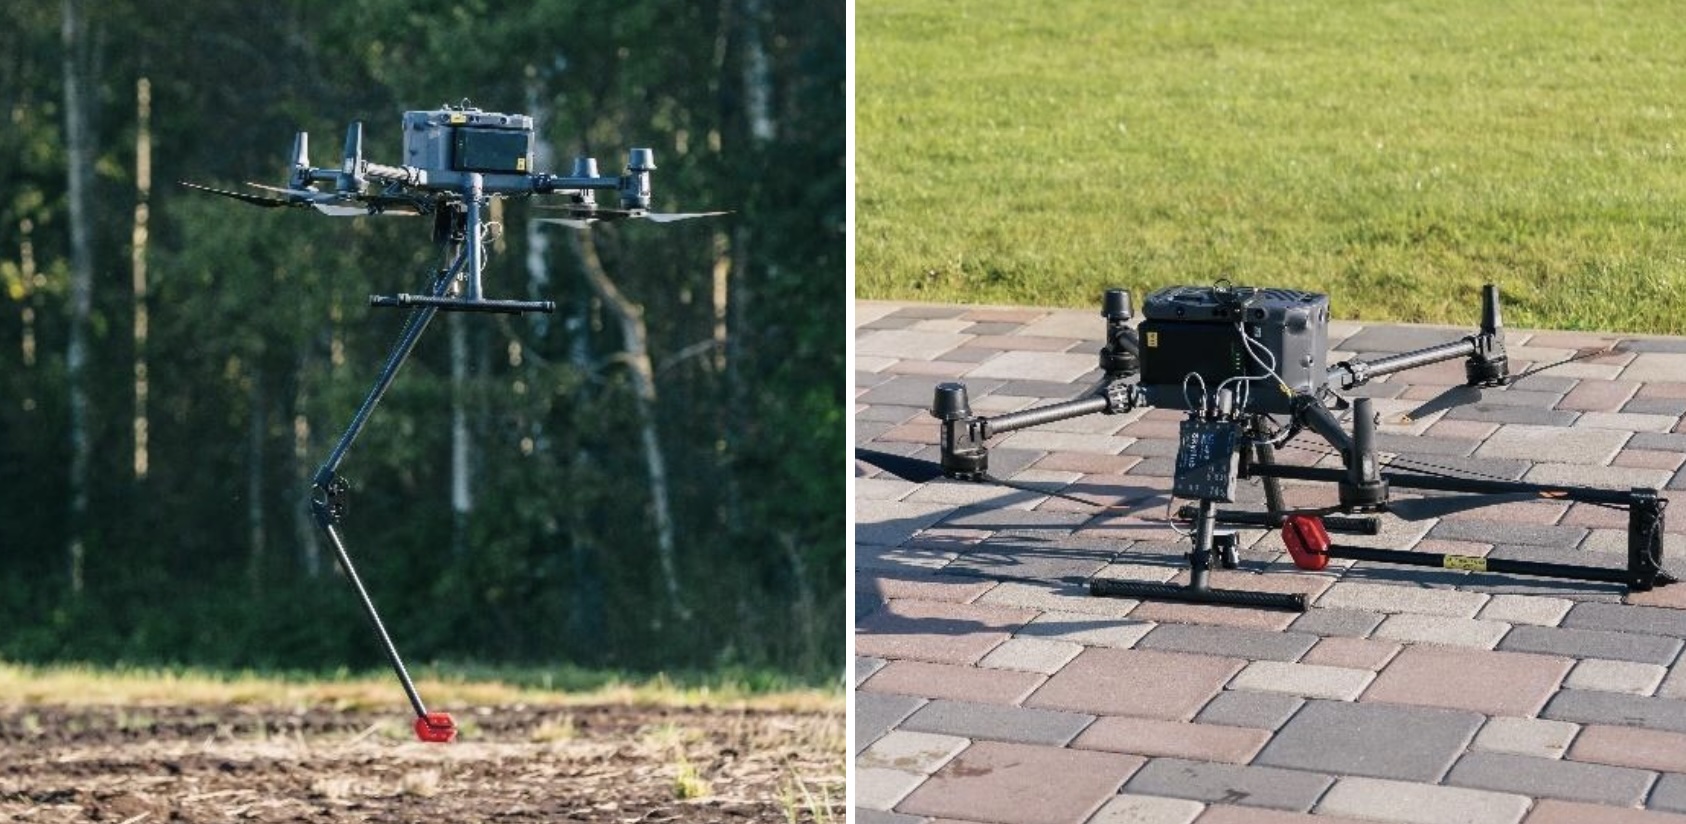
MagNIMBUS
Manufactured by SPH Engineering, MagNIMBUS is an airborne integrated magnetometer system that uses a QuSpin QTFM Gen-2 atomic total-field magnetometer sensor (figure 2). The sensor is located on the tip of the self-foldable arm, which allows data acquisition while flying with an extremely low surface-to-sensor clearance – starting from just a couple of dozen centimeters. The foldable arm reduces the chances of the UAV crashing when touching the ground or obstacles in the path. This capability boosts the chance of finding small UXO items in fields with dense vegetation. During the survey, the QuSpin sensor recorded total magnetic intensity (TMI) at a rate of 250 Hz. The setup was flown at a constant speed of 2 m/s for all three altitudes.
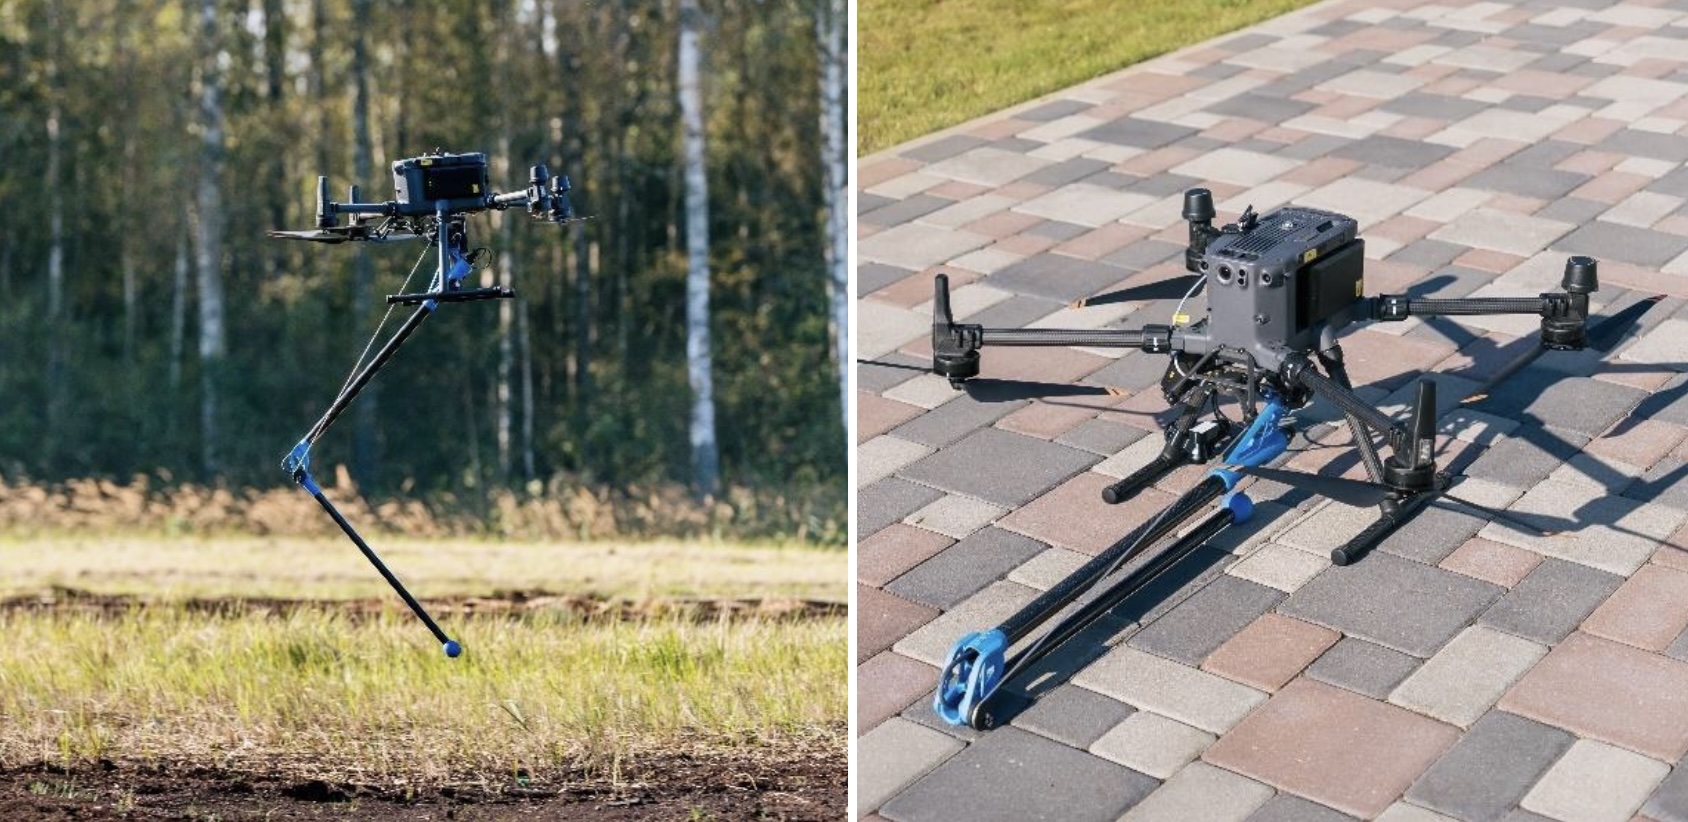
MagDrone R1
The MagDrone R1 by SENSYS GmbH is a portable tri-axial single-sensor magnetometer system (Figure 3) that utilizes a high-quality carbon fiber self-foldable sensor arm for minimizing the risk of equipment damage during surveys while maintaining the distance to the ground as low as possible. It can be attached to any UAV with a minimum payload of 1kg. During the survey, the triaxial flux-gate magnetic sensor recorded vectorial magnetic components at 250 Hz. The setup was flown at a constant speed of 1 m/s for all three altitudes.
Data processing
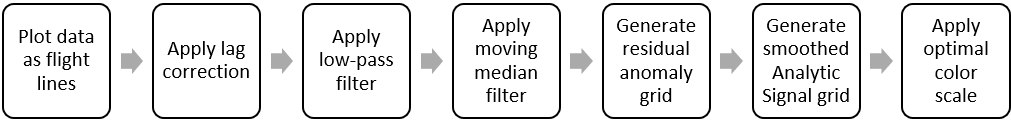
Magnetic data processing for both magnetometers was done on the software Geosoft Oasis Montaj Standard Edition v.2024.1. Most of the data processing consisted of the principle workflow visualized in Figure 4.
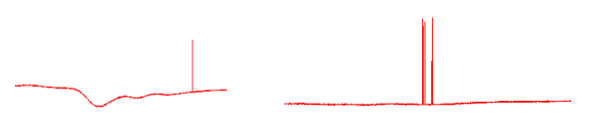
When inspecting MagNIMBUS data with a 0.2 m flight altitude, small discrepancies were noticed. Very short but high-amplitude noise spikes emerged where a non-linear filter (NLF) was applied, which is ideal for removing such errors, as shown in Figure 5.
Data visualization
Data visualization is a crucial step in data processing for comparing various magnetometer datasets. Resultant magnetic anomalies were visualized as an Analytical Signal (AS). All datasets were given a cell size of 0.1 m to account for the high point density along the flight paths. Since the survey was done with a 1-m separation, a blanking distance of 1 m was sufficient to cover the survey area for data interpolation.
An example of the importance of detailed data visualization can be found in the UAV-based magnetometer comparison: UXO test
Results
Flight at 1.0-m altitude
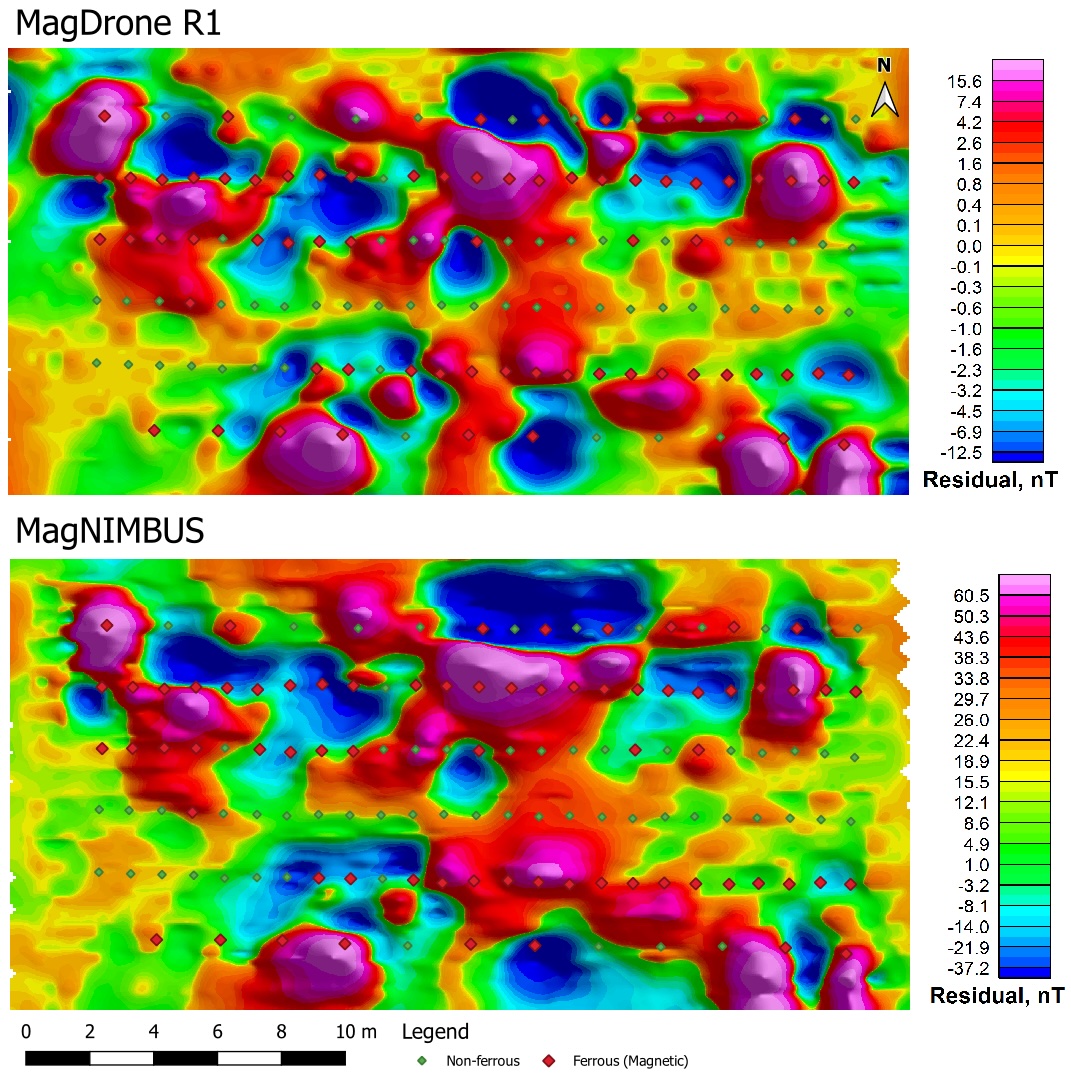
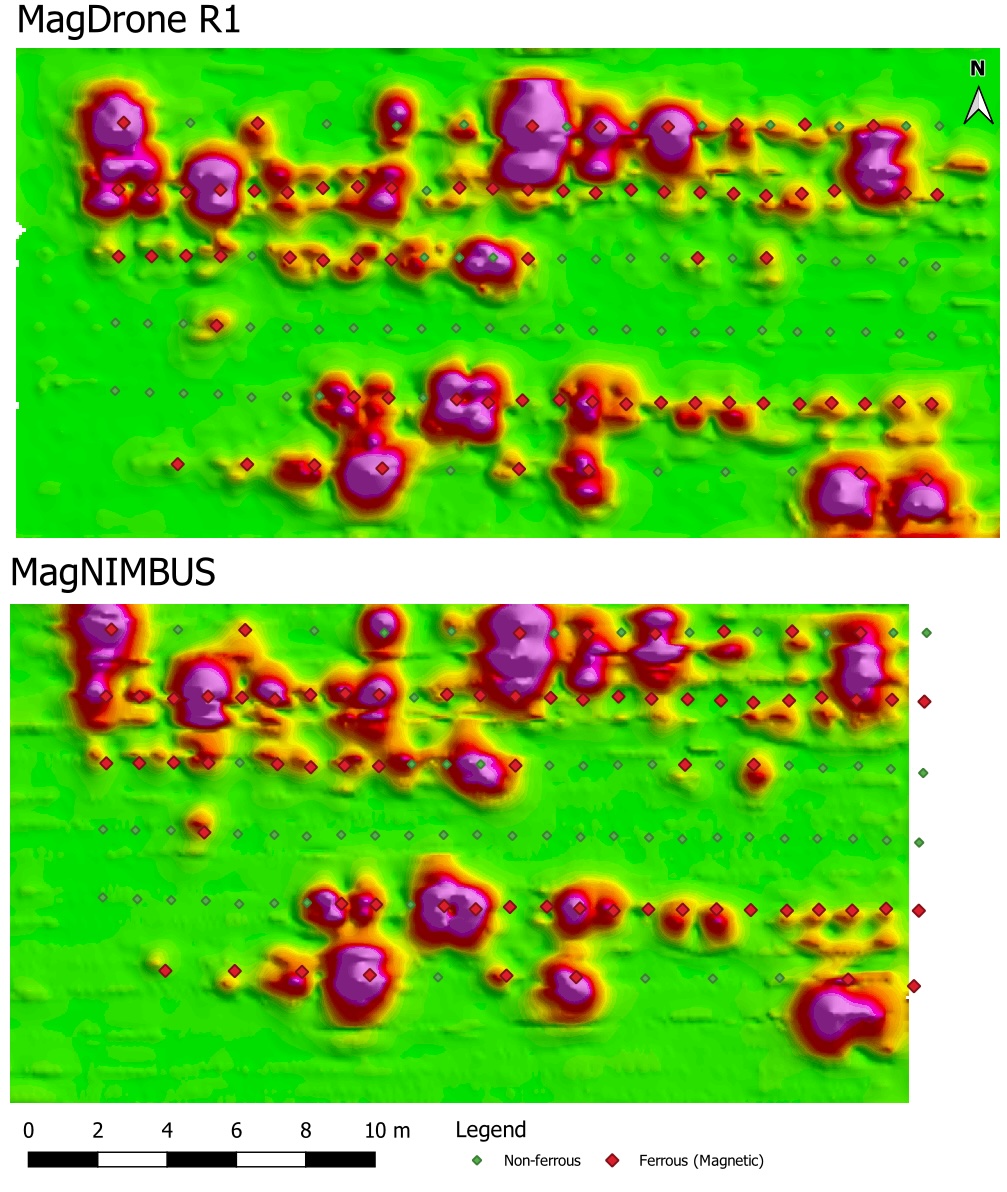
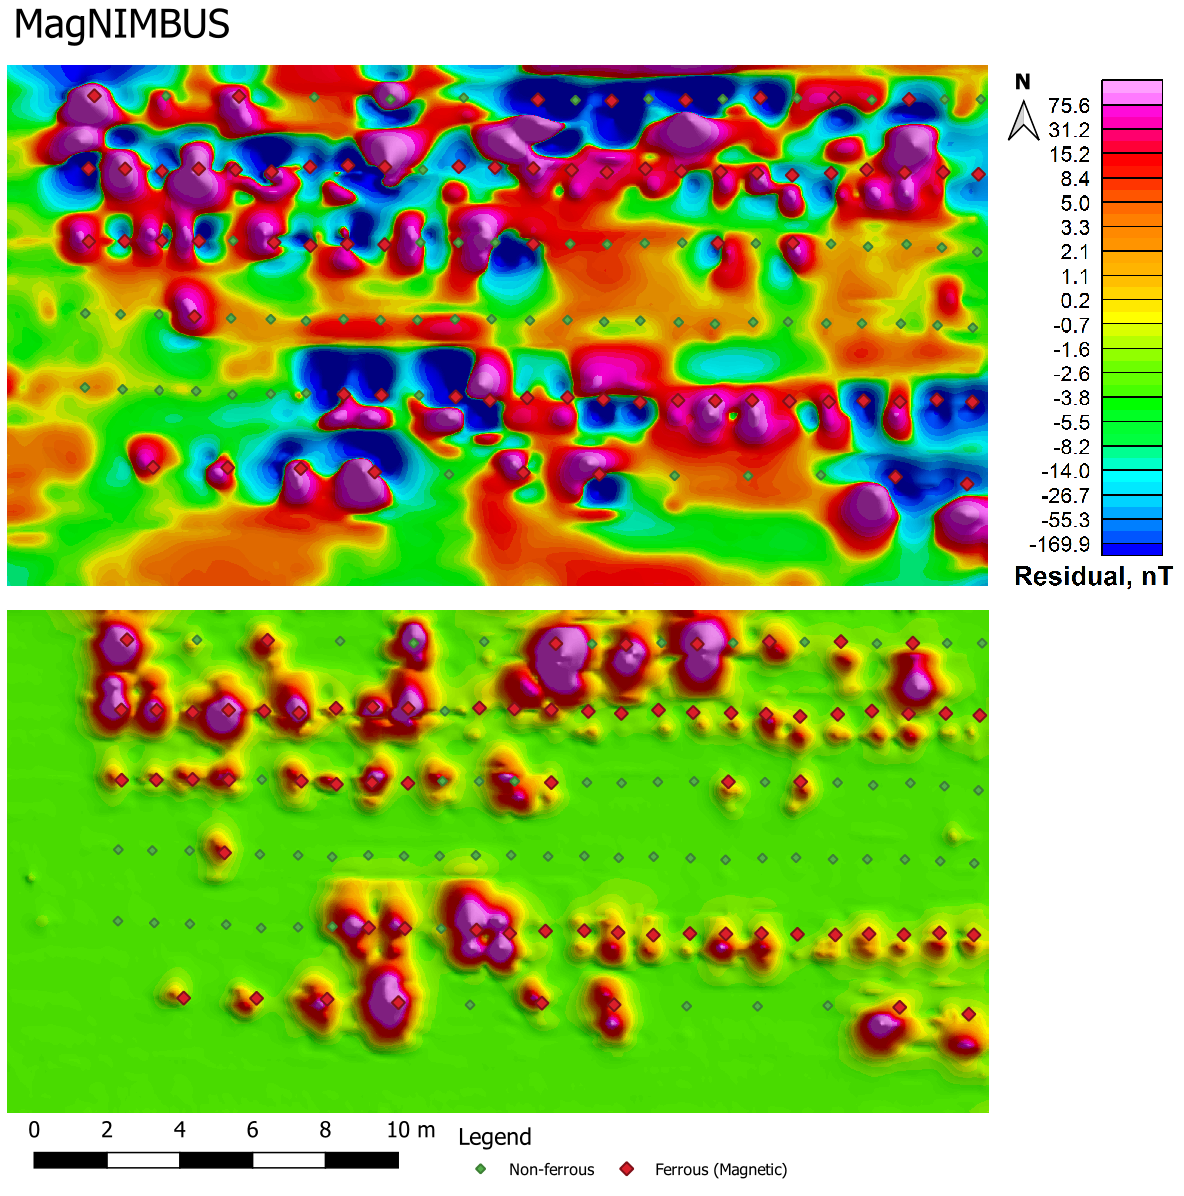
When comparing the residual anomaly grid data of both magnetometers at a 1.0-m flight altitude (Figure 6), the magnetic anomaly map shows many magnetic dipoles scattered throughout, although some differences are visible. This effect, however, was lessened using a 3x3 convolution pass (see “Appendix A—Data processing steps”).
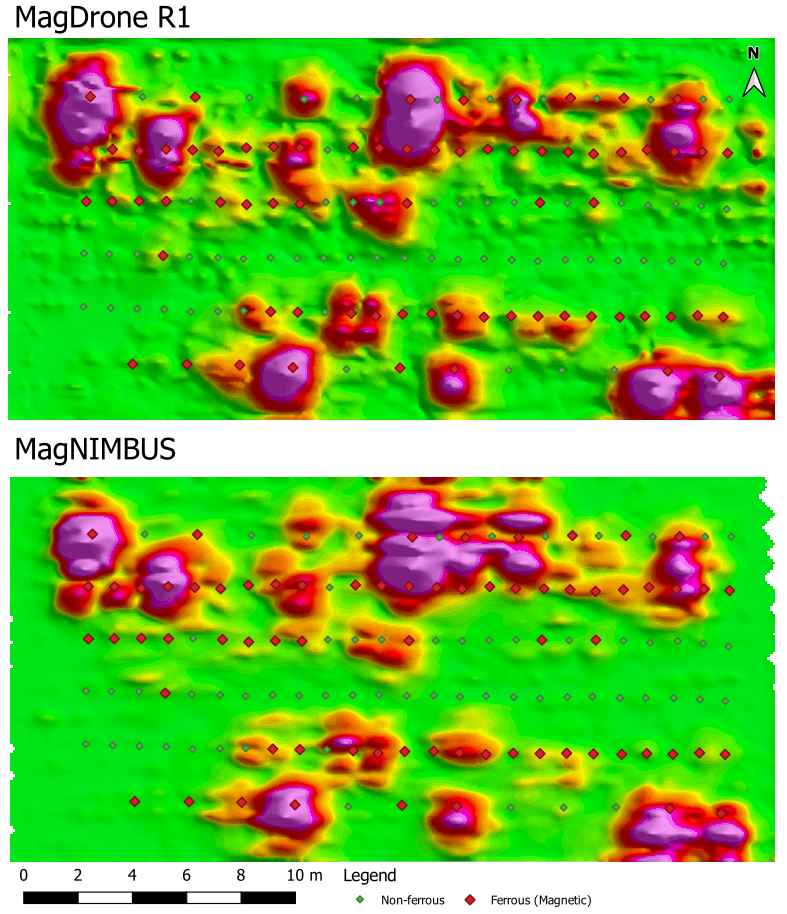
Compared to the AS grids (Figure 7), both show very similar results of both strong and weak signals. The biggest anomalous signals were made by M12Al (Practice M12 Landmine), an Aluminum Pipe bomb that most likely had some ferrous components, M228 Frag, M6 (2.36-inch Bazooka), multiple big pieces of shrapnel (weighing from 400 to 500 grams), a fuze cache and a shrapnel cache. The very high amplitude of the previously noted objects most likely obscured the signal of the smaller anomalies (colour scale distortion). Thus, smaller objects and UXOs that were scattered or buried in the test field aren`t visible from a 1-m altitude. Both SENSYS MagDrone R1 and SPH Engineering`s MagNIMBUS data show good resolution of the previously noted targets that exhibited strong signals. Although some streaking is noticeable in residual grids, this however didn`t affect detection quality.
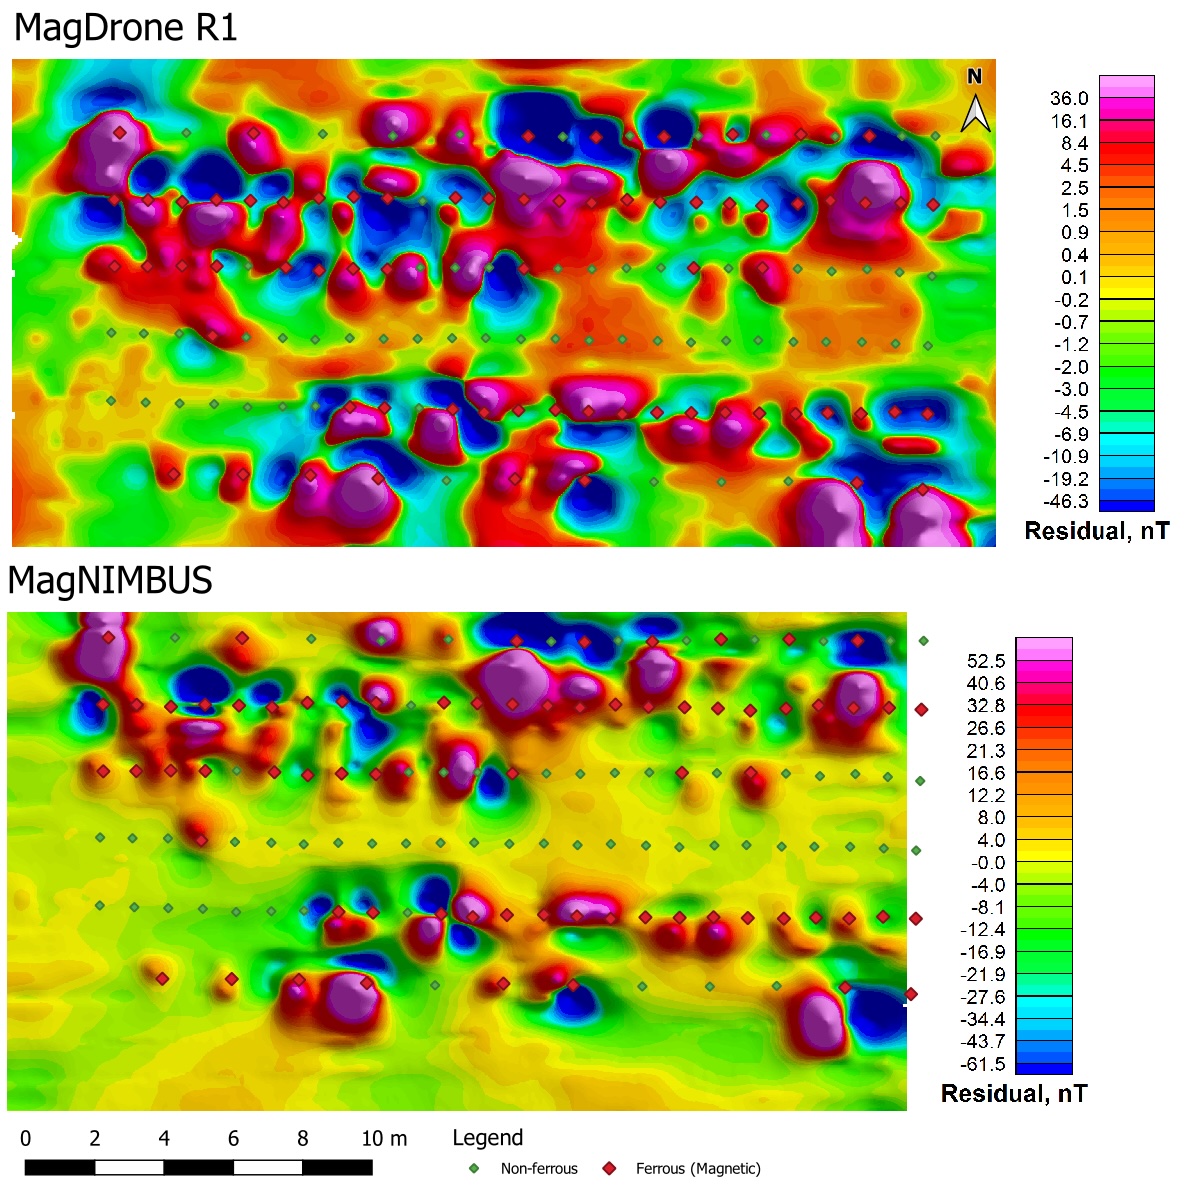
Flight at 0.5-m altitude
At the flight altitude of 0.5 m, smaller targets were detected more easily as the altitude to the target was reduced by twofold. In the residual anomaly grid, the magnetic dipoles are more pronounced, but because the targets are placed so close to each other, it creates two magnetic dipoles that are harder to interpret where the actual target is located, as seen in Figure 8. This, however, has no effect in the Anomalous Signal grid (Figure 9) where normal distribution colour scale is applied where both noise is greatly reduced and peak anomalies are shown. There also is less pronounced streaking in both maps (compared to data from 1.0-m altitude), which enhances the total quality of maps.
Flight at 0.2-m altitude
The data for MagDrone R1 with a 0.2-m altitude wasn`t included in this report as time limitations and technical difficulties prevented the collection of this data set.
At the flight altitude of 0.2 m, the smaller targets are much more pronounced than previous flight altitudes (Figures 10) as the distance from magnetometer to target is one-fifth as per 1.0-m case or more than halved in 0.5 m flight altitude (this is if the target is on the surface level). The rows C and E, which had small targets such as various projectiles and metal shrapnel pieces (M2A3, Inert Warhead, M69`s, M49A3, M918), were also notably more visible at this altitude.
Picked targets
For the process of target selection, anomalies exhibiting the highest peaks in comparison to the background noise were identified. The initial step involved inspecting the residual grid, followed by examination of the analytical signal (AS) grid. Only anomalies that showed sufficiently prominent peaks were considered for selection. Target identification relied on the authors' interpretation, with the geotagged target map feature disabled. Smaller anomaly picking, which was hard to interpret, such as those associated with streaking artifacts, were excluded at the flight altitude of 1.0 m.
Once anomalies were selected, a buffer zone with a radius of 1.0 m was established around each anomaly to ensure the inclusion of nearby ferrous and non-ferrous targets. This approach was adopted because some anomalies, upon closer inspection, did not precisely correspond to the recorded target locations. This discrepancy was most evident in the lower right corner of the survey area, where two separate caches of fuzes and shrapnel were located. These inconsistencies may be attributed to imprecise target geotagging, as most anomalies aligned well with their geotagged locations.
It is important to highlight that the flight path was not ideal and did not always align perfectly to cross directly over the targets.
1.0 m flight altitude
At the 1.0-m flight altitude (Figure 11), the most prominent magnetic anomalies were associated with 20 targets for MagNIMBUS and 21 targets for MagDrone R1, which are displayed in Table 1.
Non-ferrous targets remaining within the grids do not necessarily account for the anomalies observed in the magnetic data. As previously noted, the test range is situated on a former explosive testing site, resulting in significant contamination by small metal fragments. These fragments are likely to interfere with the acquisition of magnetic maps and subsequent data processing. Furthermore, some non-ferrous objects contain ferrous components, rendering them not entirely non-ferrous.
0.5-m flight altitude
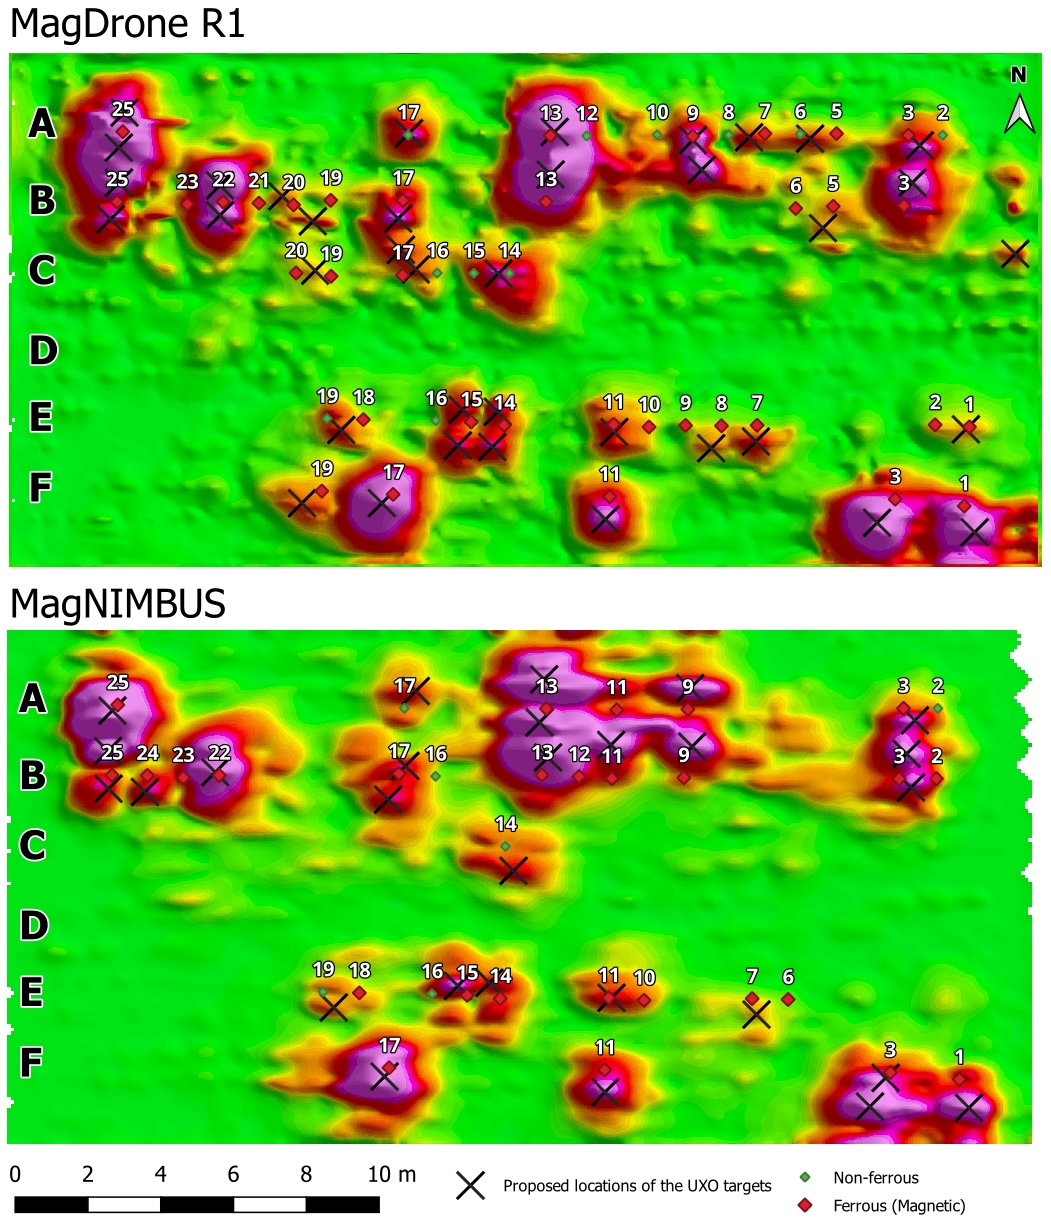
The results improve significantly when examining data collected at a flight altitude of 0.5 m (Figure 12), where smaller, individual objects become distinguishable. In total, 43 objects were detected with MagNIMBUS and 41 with MagDrone R1 (Table 2). For instance, along line D, object 22 is identifiable in both the MagNIMBUS and R1 magnetic anomaly maps. This object corresponds to an anti-personnel blast mine (PMN). In contrast, MagNIMBUS detected a target that was not identified by R1: along line C, object 6, which is an M918 40 mm practice round with a spotting charge.
Additionally, targets along line F, specifically objects 23 and 21, exhibited visible anomalies in the MagNIMBUS data compared to the MagDrone R1. These objects were identified as Huawei and HTC phones containing some ferrous components. Such variations in target detectability are most likely due to slightly different flight paths (i.e., one system flies closer to the target, thus recording a stronger signal), and not necessarily due to differences in magnetometer sensors.
0.2-m flight altitude
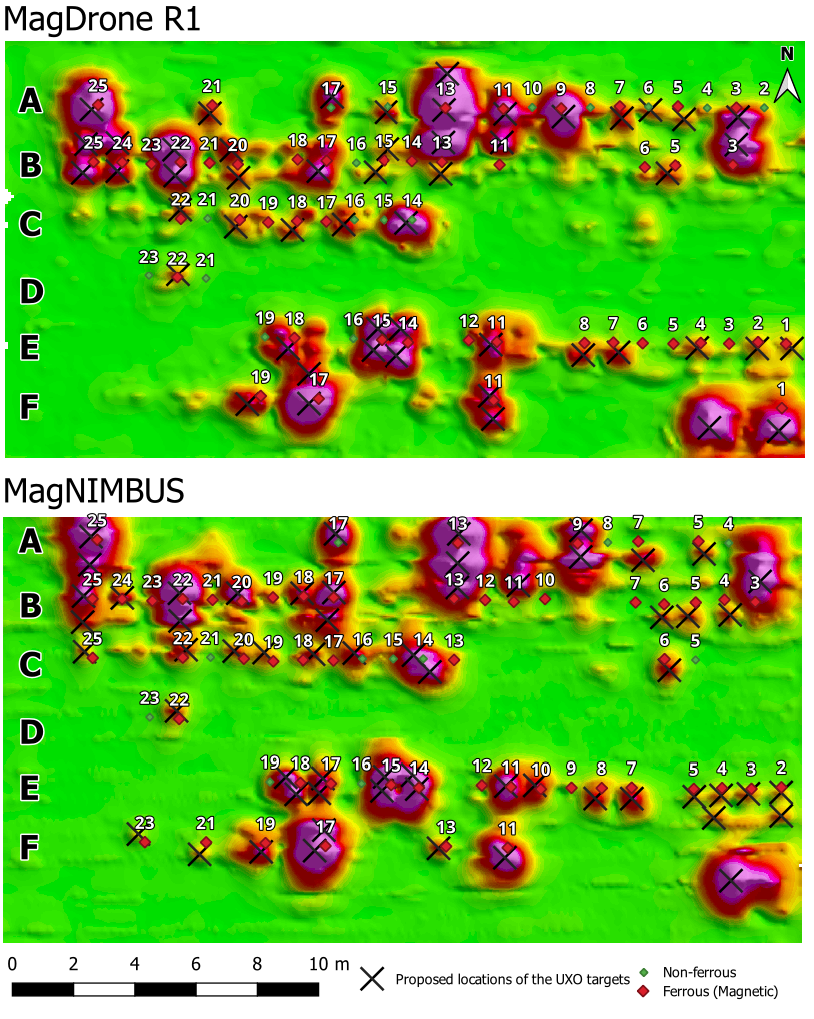
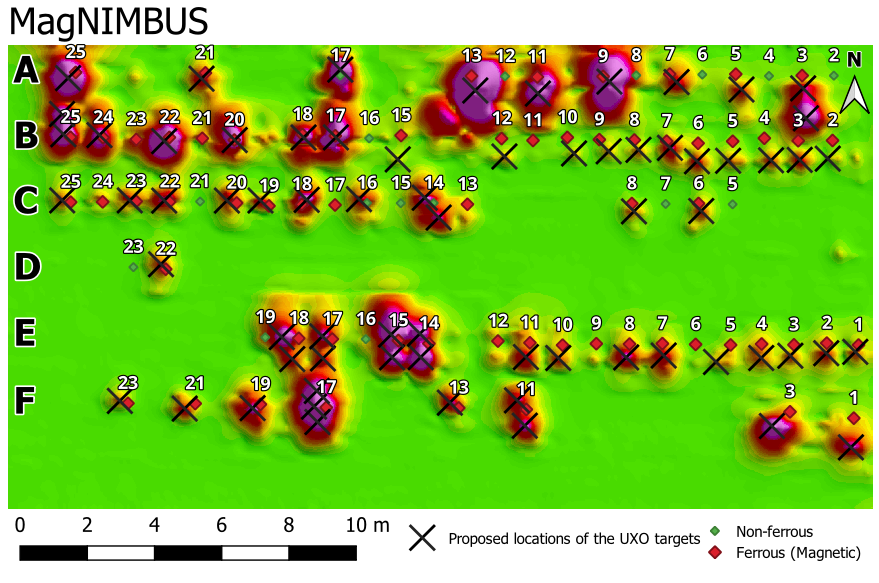
Due to the technical issues that affected MagDrone R1 data, only MagNIMBUS data were analyzed for this flight altitude (Figure 13). In total, 57 objects were identified from magnetic anomaly maps. The flight altitude of 0.2 m proves to be highly effective for detecting very small, closely spaced, or buried targets, as seen in Table 3. Notably, lines B, C, and E reveal targets separated by just 1.0 m from one another.
Additionally, targets A17, C16, and C14, identified as non-ferrous objects, exhibit anomalies similar to those associated with ferrous objects. Upon further investigation, including visual examination and review of their characteristics, it was determined that A17 likely contains a ferrous ring around its projectile, causing it to appear in the anomaly map. Similarly, C14, a 40 mm drill round with a non-ferrous body, features a ferrous casing, as does C16.
Conclusions
- Both tested sensors – MagNIMBUS and MagDrone R1 – performed similarly well, detecting 20 and 21 out of 131 ferrous and non-ferrous objects at an altitude of 1.0 m, and 43 and 41 targets at an altitude of 0.5 m.
- Among all the targets in the seeded field, a total of 57 objects were identified using the MagNIMBUS magnetometer at a flight altitude of 0.2 m. This represents the highest number of detections achieved under these conditions, highlighting that lower altitudes significantly enhance detection results.
- While decreasing flight altitude greatly improves the detectability of smaller targets, it also requires decreasing the separation distance between flight lines to ensure sufficient data coverage.
- The significance of an operational Real-Time Kinematic (RTK) system in magnetic data recording cannot be overstated. Accurate and precise data acquisition is essential, particularly when detecting small unexploded ordnance (UXOs), as this requires maintaining both an exact flight path and altitude. The necessity arises from the fact that the magnetic field—and consequently the detection range—diminishes with the third power of the distance.
- Test fields, such as the Demining Research Community’s Seeded field at the OSU Center for Fire and Explosives, Forensic Investigation, Training and Research range play an important role in UXO detection research, allowing to test the detection hardware in controlled conditions, as well as to improve skills of the operators and data interpreters.
Acknowledgments
Special thanks to Jasper Baur and Gabriel Steinberg from the Demining Research Community, who arranged for SPH Engineering access to the test field and provided all the required information to conduct a successful data-gathering survey.